SaaS Financial Model
A 21-sheet integrated Excel and Google Sheets model. Three-statement output with balance check. Monthly MRR and ARR waterfall broken down by plan and segment. A 60×60 cohort retention engine with fitted LTV.
TL;DR
- GAAP-consistent three-statement integration.
- Driver-based ARR and MRR waterfall modeling.
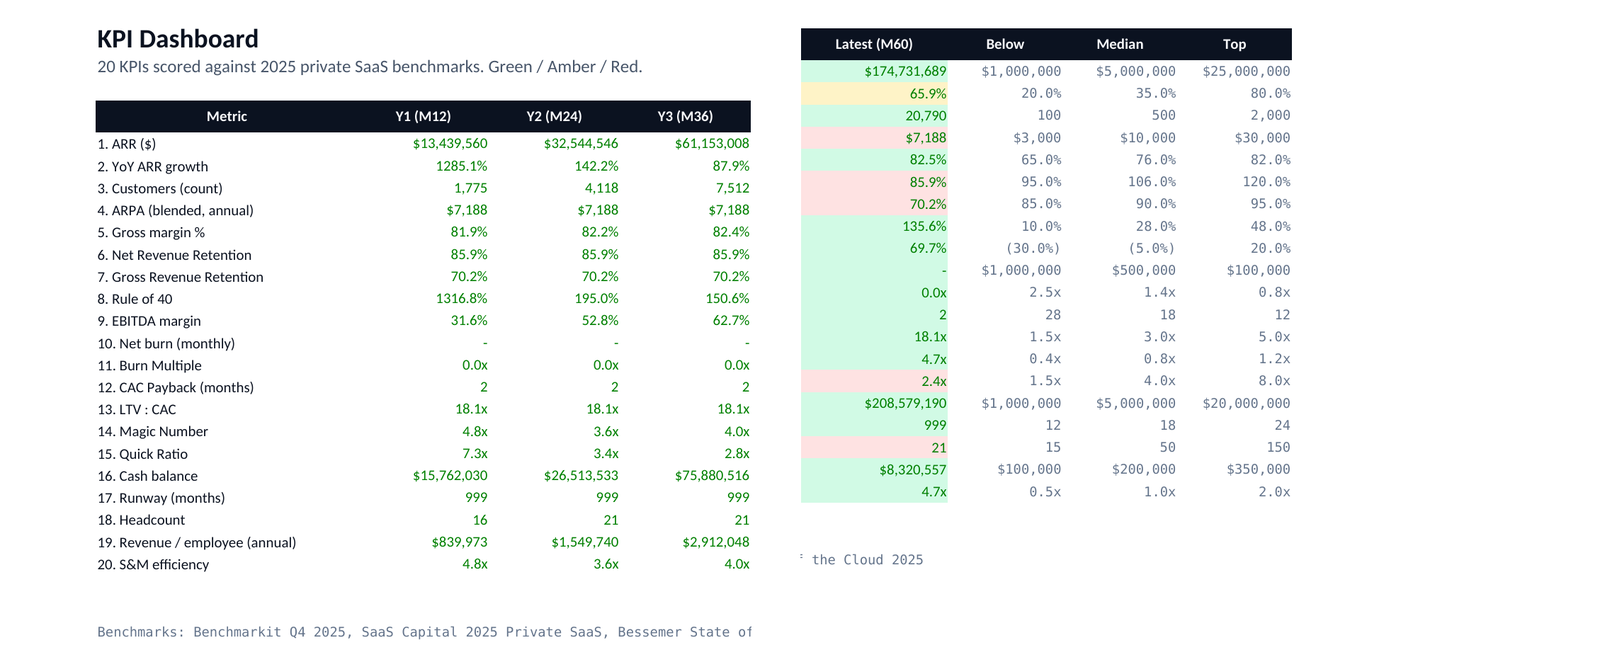
- KPI dashboard pre-scored against 2025 private SaaS benchmarks.
- Mini cap table with SAFE modeling and scenario switcher.
Inside the model (21 sheets)
Click any image to enlarge.
Built-in Benchmark Scoring
RULE_OF_40       28%        ● GREEN   (median 28%)
BURN_MULT        1.4x       ● GREEN   (median 1.4x)
NRR (TTM)        106%       ● GREEN   (median 106%)
CAC PAYBACK      18 mo      ● GREEN   (median 18 mo)
MAGIC_NUMBER     0.7        ● AMBER   (median 0.8)
QUICK_RATIO      4.2        ● GREEN   (median 4.0)
What's Inside (21 Sheets)
| Section | Sheets | Description |
|---|---|---|
| Statements | 3 | Income Statement, Balance Sheet, Cash Flow. GAAP consistent. |
| Revenue | 4 | MRR/ARR waterfall, pricing tiers, expansion revenue, churn logic. |
| Cohorts | 2 | 60x60 retention matrix and fitted LTV analysis. |
| Expenses & HC | 4 | Headcount planning, compensation plans, Opex schedules. |
| Cap Table | 2 | Founder shares, option pool, and SAFE modeling logic. |
| Outputs | 6 | Dashboard, One-page Teaser, Scenarios, Config, Charts. |
Specifications
What's NOT included
- ✕ Custom industry verticals
- ✕ Live data API feeds
- ✕ 1-on-1 setup calls
Added LATAM currency variant supporting MXN, BRL, COP, and CLP. Fixed a rounding inconsistency in months 12 through 24 of the cohort fit. Updated the 2025 benchmark reference tab with Q4 Benchmarkit data.
Read full changelog →Frequently Asked Questions
Does this model work in Google Sheets?
Yes. Every Meritra template is built without macros and rigorously tested in both Microsoft 365 / Excel 2016+ and current Google Sheets.
What stages is this model for?
Seed through Series C. The logic accommodates both pre-revenue projections and mature cohort retention modeling for scaling SaaS businesses.
How does the benchmark scoring work?
The model uses conditional formatting to color-code your KPIs against private SaaS median and top-quartile data from the Benchmarkit Q4 2025 report.
Is the LTV calculation capped?
Yes. We utilize a fitted retention curve with a 5-year cap, aligning with how top-tier venture firms evaluate customer lifetime value.
Can I use this for multiple clients?
The standard $149 license is for a single seat. If you're a fractional CFO or agency using it for multiple clients, purchase the Agency Tier for $299.
Do you offer refunds?
Yes. We provide a 14-day unconditional refund. Just email hello@meritra.co and we will process it, no questions asked.
14-day unconditional refund.
Secure checkout via Polar.